There is so much to think about when trying to convey abstract information in a concrete and useful manner. With all of the currently accessible tools, we can make a lot of pretty visualizations but are they valuable representations of reality? Much thought, from color schemes to categorical axes, should go into how we represent our data. What struck me the most in the readings for this week was the concept of all data as capta. This term is new to me. What it boils down to is that data is not something that is just out there for us to discover. We make it.
In a way, all data is qualitative. Some things can be enumerated. Yet, the categories for counting are socio-cultural constructs, usually embedded in binary categorizations which work well to order things but do not reflect reality. Furthermore, as Katherine Hepworth and Christopher Church point out, there are power-laden underpinnings to the standard ways that we visualize enumerated data. Bar charts, line graphs, and other old-school vehicles for data visualization are products of colonization. So what do we do if we take such a phenomenological perspective? How do we ethically relay information in digestible formats which any of my relatives would understand, while at the same time pay close attention to the situated knowledge and power inherent in our visualizations?
There were a couple of examples brought up this week which help in thinking about the subjectivity of data visualization and ethical considerations: Hepworth and Church’s exploration of two mapping visualizations on lynching and white supremacy in the United States and John Snow’s cholera maps from 1854 as critically explored by Johanna Drucker. In regard to the latter, Drucker helped make the concept of data as capta easy to understand by looking at Snow’s famous map of London’s Soho district, populated with dots of cholera cases. As mentioned in the extremely handy The Historian’s Macroscope: Big Digital History, Snow’s dot-density map was not the wrong type of map for pinpointing the source of the disease (As the authors of this book let us know, there are no “right” visualizations). It worked in ferreting out the water pump. Yet, as Drucker shows, such a map is an example of “co-dependent constructivism.” In other words, the “realism” of the map is “observer-independent.” The only variable that defines a person is that they have cholera. Drucker posits the question, “But what if we take the rate of deaths, their frequency, and chart that on a temporal axis inflected by increasing panic?” Or, in other words, how does one redraw the landscape to include emotions and gazes of those on the landscape? Much of what we read this week reminded me of Haraway’s “god-trick” explored in a previous post. Visualizations have a disembodied objectivity which is not reality.
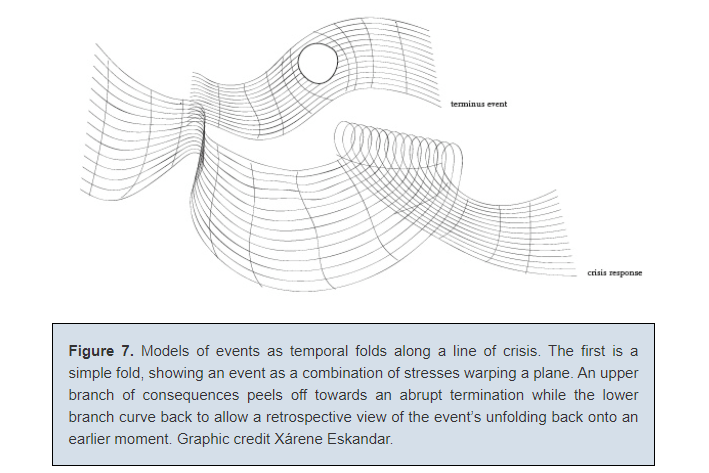
Drucker brought up many interesting ideas for how we can think about and represent landscapes and temporalities that expand beyond cartesian models. Although she ended up with visualizations which reminded me more of charts in quantum physics books (See image above), the exercise of thinking about the relativity of time and space is important. If two people are riding together in a car down the freeway and one really has to go to the bathroom, those ten minutes until the next rest area will not be the same for each person. What it comes down to is understanding that the numbers we are visualizing are not just artifacts themselves, but also represent people, each with a situated perspective. Landscapes are complex.
Hepworth and Church show how the intentions of creators of representations of landscapes can mask such complexities. They critically examine the Equal Justice Initiative’s (EJI) Lynching in America choropleth map in relation to the Monroe & Florence Work Today’s White Supremacy Mob Violence interactive map. EJI’s work narrows the viewer’s focus to the south and focuses solely on lynching of African Americans. EJI’s map works extremely well in relaying the terror of lynching and its lingering geographical legacies. Yet, as the authors argue, their focus on the south and only African American mob violence masks the extent of structural racism and white supremacy. The White Supremacy Mob Violence map includes not just violence against other groups, notably Native Americans, but also extends the gaze across the United States. Additionally, the interactive nature of the map allows users to uncover personal information about victims and vignettes which give historical context. Careful planning from pre-data collecting to the publishing of visualizations can remedy blind spots and push historians to, as the authors claim vis a vis Alan Liu, “communicate humanity” by paying close attention to cultural criticism. So, this brings me to how I will think about space, time, and people when I move into my own projects.


We did a non-geospatial visualization exercise this week where we chose from a plethora of data to create representations in Flourish. I found some data from the City of Albuquerque which is one of the most generous municipalities with their datasets. I have to say, it came out pretty nice. After reading the instructions on what visualizations work best for the data you are representing in The Historian’s Macroscope: Big Digital History I decided that the hierarchy circles template would relay information on pollen data well. One would think that such a representation would be free of ethical and methodological issues. Nevertheless, there are variables masked in a representation like this. First of all, who decides what is the “west” and “east” of the city? More important, who are the people living in these areas? How does this fit with air quality in general? What kind of housing stock is in these areas? There are many other questions which could pop up when making a representation quickly like this. The simplicity of making such visualizations without any real preliminary work is a bit frightening after our readings for this week. This thing is published online. Is it saying something I don’t want to say?