The Purpose of Microhistory is to elucidate historical causation at the level of small groups where most of life takes place and to open the history up to peoples who would be left out by other methods–Edward Muir1
I will get back to the book list from the last post soon and complain a bit about the history of what “we” eat, but I just can’t shake a question posed by my advisor. As I started working out what will probably be a dissertation on food systems in West Michigan at a meeting of my committee, they asked what keeps my study from being microhistory. I responded that most people live and did live in “midsized” cities, and when the US became more urban than rural during the teens most people did not live in places like New York and Chicago, but in cities like Grand Rapids. They rightfully questioned this bald assertion as I did not have the data with me, and I also knew that definitions of urban and rural are dubious at best. Yet, there is evidence for my argument.
First, when one looks at the current data, it is obvious that most people in the US don’t live in huge metropolises. Here is a tree map of populations by city:
Yet, as the 1920 census outlines well, urban areas are not bounded by municipal boundaries, and suburbs are not only geographically, but also “industrially and socially are parts of the cities themselves, differing only in the matter of governmental organization.” While I do not agree completely with the social aspect and, as a person who grew up in a suburb of a small city, would vehemently argue that they are culturally distinct, urban areas are not simply cities and a better categorization would be “metropolis.” When looking at current metropolises, one gets this:
I added the names of the lower and upper-end areas to give an idea of what metropolises are in each category. This gives an idea culturally of these places. For example, it can be argued that, barring the LA Chicano influence, the Phoenix area is more culturally aligned with Grand Rapids than Miami. Admittedly, these categories are pretty arbitrary. Albuquerque is just under one million, and as a person who lived for about five years in that town, it is more like Grand Rapids than Hot Springs AK. (In fact, I am beginning to see similarities between Albuquerque and Grand Rapids as I drift away from my reading list from last week and think about other things I have read such as a chapter on the political ecology of southwesterm Michigan and a monograph on New Mexico agriculture. But I don’t want to digress down that rabbit hole yet).
So, there is some contemporary evidence for my argument. The historical data is much more difficult to neatly show here. Definitions are slippery and every report comes with a warning to not make direct comparisons. Yet, it seems that there is a general consensus among US historians that the nation became urban by 1920. Yet, the definition for urban was anything over 2500 people (except for RI, MA, and NH which the explanation is not clear). You can read about it here in the 1910 census on page 53 or the 1920 census on page 43 where this table can be found:
So, whether more people lived in places like Grand Rapids than New York or Chicago is not really the relevant argument, but the fact that tens of millions of people did and still do makes their stories important in the national narrative. And, it could be argued that a massive chunk of history in the United States is suspended in a liminal state between urban and rural.
For example, I just finished reading a narrative of the history of Michigan, and the number of pages dedicated to the east side of the state and the auto industry was massively disproportionate to those on the west side cities and their industries/ Most notable was the dearth on the importance of agricultural products. The author noted Grand Rapids for its furniture and contribution to wartime troops (granted the author is a military historian). While there were more mentions of GR in the text than the twelve listed in the index, most of the history was Detroit-heavy. For example, there was no mention of black uprisings in the late 1960s outside of Detroit.
While I obviously have a bias, I am not simply splitting hairs. And if my work is considered a “microhistory” so be it. But to put it into perspective, would a study of Rochester NY, whose metro area is smaller than GR be microhistory? Or does metahistory in the United States have to fit into a particular socio-cultural narrative? I can’t answer these questions, but they do help me think as I continue reading. What do you think?
Ruggiero, Guido, and Edward Muir. 1991. Microhistory and the Lost Peoples of Europe. Selections from Quaderni Storici. Johns Hopkins University Press. https://search.ebscohost.com/login.aspx?direct=true&db=cat09242a&AN=msuc.b144253689&site=eds-live.
I am trying to wrap my head around the relationship of food and democracy, and am currently trying to disentangle the political economy of food from the role of food in political economy….Something will be here by tomorrow…
Some Grand Rapidians gardening in 1917. Grand Rapids Progress, May 1917, 6(5): p. 16 form Grand Rapids Public Library Special Collections.
Last week I left off thinking about that space between a claim and a reason in an argument. It was a good exercise in thinking about relevance and pushed me deeper into exploring how to frame my research. I know I want to use public retail markets and urban gardens as spaces from which to study the history of municipal political economy/ecology. More specifically, I want to emphasize the importance of mid-sized cities as historical representations of many (if not most) people’s experiences. Large cities and rural areas dominate the narrative, while “secondary” cities tend to be in the footnotes or the academic realm of amateur “local historians.” This is most definitely true when looking at the history of public marketplaces and public gardening programs.
Blueprint for Fulton Street Farmers Market, 1927, GR City Archives
While food history monographs are no longer a rarity, books dedicated to public marketplaces and gardening programs in the United States are still sparse. Concerning gardens, Laura J. Lawson’s City Bountiful[1] stands as the go-to source to cite if a food scholar wants a historical antecedent section in their work. Lawson draws off the massive trove of primary documents produced by organizations running gardening programs, most of which is promotional literature, [as a side note, MSU’s library has much of this digitally available thanks to librarian Suzi Teghtmeyer. Check it out here] to construct a narrative which starts with the vacant-lot programs of the late 19th century, most notably the work of Mayor Pingree in Detroit, and ends with her own ethnographic work on contemporary gardens. Lawson’s long durée is an invaluable addition to the historiography of public gardening programs in the twentieth century and her reliance on publications created to advance and report on gardening programs may get at the social issues these programs set out to solve, but it only scratches the surface of cultural presuppositions by those who implemented them. Further, her work barely includes programs outside large cities.
Interestingly, Lawson’s periodization and framework comes from Thomas Bassett’s unpublished 1976 master’s thesis which incorporated a cultural ecology framework to analyze the history of vacant lot gardens in the United States.[2] Amazingly, Bassett’s work continues as the standard starting point for those studying the historical movements in urban gardening programs in the United States. It is not a surprise that the historiographical periodization for gardens would come from cultural ecology and urban planning. Indeed, it seems that people outside the discipline of history dominate histories of gardening programs and public marketplaces. Even my own first foray into the history of public markets and gardens happened while studying in the Community Sustainability program at Michigan State.
Concerning US marketplaces, the pioneering work on their history came from an article by geographer Alison Brown in 1999.[3] American Studies scholar Helen Tangires, however, went beyond “counting farmers markets” and placed public marketplaces within a social history framework. Her first work looked at 19th Century development of “civic marketplaces,” mostly in large cities, and their demise in the Progressive Era. She does not hide her activist spirit in this work and, reflecting the local food renaissance of the turn of the last century, she considers public markets as a barometer of a city’s moral economy. The current city dweller, she argues, can avoid the “dangerous and immoral consequences of growing genetically engineered crops, of using bones and offal from diseased animals for feed,”(p. xv) and other negative aspects of the food system at public markets, spaces which she calls the “city’s conscious.” While this may seem hyperbolic, there is some merit to the argument. [4]
Tangires’s second monograph follows the trajectory of market districts in big cities and their evolution into part of the corporate distribution systems of the 20th century. With the help of USDA direction, she finds, cities abandoned the neighborhood retail markets in the 1920s and invested in wholesale market districts. While this may have been the case in big cities, my own research in Grand Rapids and other cities in Michigan, tells a different story. [5]
Grand Rapids, in particular, opened three neighborhood retail markets, in direct opposition to a USDA report (but aligning with labor leader Samuel Gompers’ treatise Markets for the People). Tangires does mention in her first monograph that small cities like Dubuque did not need large marketing centers, and were well-served by “curb markets,” which are transient spaces where farmers can sell directly to customers on city streets and were very popular during the first world war. Yet, beyond a temporary bandaid, retail farmers markets fade into obscurity until their resurgence in the 1970s. As I have argued elsewhere, this periodization of public markets in the United States where market districts become the norm in the 20th Century is not representative of mid-sized cities. This is not simply a historiographical quibble. It can mislead development when feasibility reports depend on such histories. In Grand Rapids, such a perspective contributed to the current gentrification of public markets spaces that either cater to those outside the market or are part of a plan to “revitalize” a neighborhood on its way to a “market district.” But I digress.
Coffee and Supercars. The Grand Rapids Downtown Market Serving the People Living in a Food Desert.
A more recent monograph comes from historian Gergely Baics on New York marketplaces in the 18th and 19th centuries. His work is helpful in thinking about markets as spaces of conflict. While I do not agree with his criticism of a moral economy framework being too focused on cooperation over conflict (I mean EP Thompson was writing about food riots, right?), his political economy framework makes sense, and may not be as far from a moral economy perspective as he argues. He presents a “tipartite model of political arbitration” whereby “customers, vendors, and city officials…constantly renegotiate the common good of food provisioning.” (p. 26) While he does not see the moral economy as a process, I do (I will explore this theoretical approach in a different blog). Epistemology and semantics aside, Baics uses spatial approaches to the study of public and private markets in New York city, mapping food environments and measuring food access based on social variables. Most fascinating is Baics’ work tracking, in the words of Braudel, the rhythm of provisioning for some typical New Yorkers, utilizing maps and diaries. Uncovering this agency of citizens is a goal I am pursuing. However, it will be more difficult to obtain the primary documentation in a city like Grand Rapids. Diaries of New Yorkers abound. [6]
This is not the first time I explored these works, and I will continually be revisiting them throughout my dissertation writing, I am sure. Although I planned to expand on my argument here, I went on a bit of a historiographic tangent. Oh well. Next week I want to explore some other examples of work on food and politics, extending my gaze to Latin America and possibly work in urban political ecology. Maybe I’ll find an argument.
[4] Tangires, Helen. Public Markets and Civic Culture in Nineteenth-Century America. Baltimore: Johns Hopkins University Press, 2003. https://doi.org/10.1353/book.72308.
[6] Baics, Gergely. Feeding Gotham: The Political Economy and Geography of Food in New York, 1790–1860. Princeton University Press, 2016. http://hdl.handle.net/2027/heb.34129.
So, it has been a long time since I wrote anything. Things got a bit crazy last semester. No need to get into my own issues here, though. You never know what life may throw at you, but as our sage professor in my current methods seminar, Dr. Delia Fernandez-Jones, reminded us this week, not attaining your goals does not make you a failure. It usually just means you either had unrealistic goals, too many of them, or other stuff simply got in the way. Gotta dust yourself off and get back in the saddle.
My previous blogs were more of a practice in getting comfortable writing something that would be published online each week. From here on out I will be more focused. Specifically, these blog posts will help me work out the nuts and bolts of my dissertation. Currently, my topic is local politics around food distribution and consumption in western Michigan during what is known in traditional US periodization as the Progressive Era, roughly from the turn of the 20th century to the end of the 1920s. More specifically, I am interested in what we would call “Alternative Food Systems” (AFSs) in today’s academic parlance, i.e. farmers markets, public gardening programs, etc. Whether I hang my work on this periodization is still not clear. Two semesters ago I took a course with Dr. Pero Dagbovie and he challenged us to think about what “turning points” are important for our own historical narratives and the subjects we study. For example, the “Progressive Era” is considered “the Nadir” in most African American historiography. Nevertheless, for now, I will be using Progressive Era as a short-hand for the time period I am looking into. Maybe a later blog post will tackle periodization.
Since this is my last semester for taking seminar courses, I will be pulling together strands I traversed over the last two years, bundling theory and methods honed during this period with nearly two decades of food systems studies. My starting point is a master’s thesis I wrote in 2011 on the origins of retail farmers markets in Grand Rapids, Michigan. This research led to the discovery of the work by citizens, most notably white middle-class clubwomen, and their involvement with not only promoting public food marketing, but also growing food through public gardening programs. You can check it out here, and also a book chapter here. The most obvious weakness in these works is a lack of relevance. It sure seemed important to me to craft my narrative, but I was studying a marketplace which I managed for three years~and was down the street from my house!
I do make some claims and back them with evidence, however. For example, I tie the markets to current trends in privatization/gentrification of public marketplaces, claiming that markets should be a public service. And I do claim that most historical antecedents in the alternative food systems literature oversimplify the history of farmers markets, notably ignoring the increasing number of publicly-supported markets in mid-sized cities toward the end of the teens and into the 1920s. Yet, as one of our astute colleagues in my current methods seminar, Raymundo Lopez, shared from their experience working on research projects abroad: So What?
Image take fromOtto, Jayson Daniel. “Broadening the Concept of Civic Agriculture.” Michigan State University, 2011. https://doi.org/10.25335/M5CD6W.
This Warrants a Closer Look
Does it really matter if heavyweights in food systems work like the late Thomas Lyson explicitly claimed that “the number of farmers market in the United States began to decline in the 1920s with the advent of the modern supermarket,” when the data shows this as patently false?1 Even if it was true on a national level (which it is not), in Michigan, at least twenty markets were started through the state in the 1920s. This historical framing has made its way into the historiography (a recent article in Sustainability is an exception).2 But why does it matter to get this right? What does it tell us that markets increased during this period? Why does it warrant further research? As a colleague told me during my defense of my master’s thesis, simply showing others are wrong is a strawman argument. Why does it matter they were wrong?
I know that my research does not currently have the relevance I would like. I tend to get one of two reactions when I tell people what I study. Some are super interested because they have personal connections to my subject such as living in Grand Rapids or are crazy foodie people. Mostly, though, they just stare at me blankly with a look of “Yeah, so what?”. But what I study has to be relevant, I mean they accepted me into a doctoral program, right? Everyone eats. That means everyone must care about food. Unfortunately, we tend to get self-important when we immerse ourselves in our research.
Using Wayne C. Booth, Gregory G. Colomb, and Joseph M. Williams seminal work The Craft of Research as a guide, I want to find an argument that matters, starting with a visualization of their outline of an argument.3
Image created using Booth et al,
A good argument begins with a claim, which states an idea that will be proven true or false in a study. Claims rely upon reasons, which are backed by evidence. In reality, a study could make multiple claims each justified by multiple reasons based on a bevy of evidence. This is very clear and easy to understand. For example, I could claim that the city of Grand Rapids opened its first retail farmers markets in 1917 because clubwomen demanded such spaces from the city government. This reason is based on newspaper articles, city council/commission proceedings, and publications/meeting minutes of clubwomen. While this is technically an argument, there are crucial elements missing which make it a good argument. And, my argument should be a reason for a larger claim which has broader traction. As Booth et al write, “Serious arguments are complex constructions.”4 So, let’s complicate things.
The Leonard Street Market after it was recently opened, The Grand Rapids Press August 8, p.13
The more I look back at my previous research and writing a few claims come to the fore. The broader claim I want to make is that Michigan farmers markets were part of an Alternative Food System that promoted food justice during the Progressive Era. And to bring this out even further, I could argue that just and sustainable alternatives to the mainstream, industrialized food system can find historical their origin (and similar criticisms of paternalism) in grassroots political, or more aptly civic, activism of the Progressive Era. There are issues with such a claim. First and foremost, one could realistically argue I am being anachronistic. The alternative food movement is traditionally historicized as an extension of 1960s social revolutions and prior arrangements such as farmers markets and urban agriculture tend to be framed as remnants of a nostalgic past or emergency measures in time of economic shock. Further, the Progressive Era is presented in the historiography as a time of increased mass consumption of food where modern technology and standardized diets were embraced, not pushed back against through local food campaigns and urban agriculture. Booth et al write that researchers should anticipate such arguments and “thicken” their arguments so they are ready to respond without bruising their ethos. In other words, not being the ass no one want to include in the conversation. I do have some evidence for the acknowledgement and responses against potential criticisms which I plan to cover later.
Yet, acknowledgment of possible counters is not the final piece. Booth et al add one more element, which as they admit, is the most difficult concept to wrap one’s head around, and what I want to bring up here and continue next week. Between the claim and the reason is what they call the warrant. A warrant gives the “because of” teeth. For example, the unprecedented increase of municipal and county operated retail marketplaces where farmers sold directly to consumers in Michigan between 1910 and 1930 is attributed, at least in part, to the work of prominent white women leveraging local politics. This is a reason for claiming that alternative food systems were being established through civic work which promoted food justice. Yet, what makes these food arrangements “alternative” and why is this an issue of food justice? In other words, what warrants this reason? Well, considering the latter, previous research has shown that chain grocers, which made food more reasonable during the high cost of living of this era, were not evenly distributed in cities. For the former, chain grocers were becoming the “norm” for many consumers, however, and they were an alternative to the neighborhood independent grocer which dominated throughout the late 19th century and into the 20th. For these reasons, the establishment of these markets mark an alternative to the established and emerging food retailing in areas which were not being served by chain grocers. I understand this may not be a watertight warrant and may not explain the idea of warrant super clearly, but it is a beginning. I need to further elaborate on the idea of food justice if I am to continue thinking about the relevancy of my argument, and will pick up next week there.
I want to leave with a quote from Lynn Hunt. My goal is to find an argument which has relevance for those currently working to make food access equitable. She writes: “Wisdom can be found in learning about how people in the past confronted their challenges.”5 I hope that by digging deeper into what I scratched earlier, I can discover some of that wisdom, not just from those obvious in the archive, but the actors who worked for change in their own neighborhood. So, come back next week when I continue looking for and argument and relevance. I also will begin looking at some of my evidence which may induce a new argument.
Lyson, Thomas A. Civic Agriculture: Reconnecting Farm, Food, and Community. UPNE, 2012. p.92
Edmonds, Amanda Maria, and Gerrit J. Carsjens. “Markets in Municipal Code: The Case of Michigan Cities.” Sustainability 13, no. 8 (January 2021): 4263. https://doi.org/10.3390/su13084263.
Booth, Wayne C., Gregory G. Colomb, and Joseph M. Williams. The Craft of Research, Third Edition. University of Chicago Press, 2009.
So, this is the last blog, my reflection for the class. It has been a weird semester. I am sure most students around the world would agree. Ironically, what has been most frustrating with learning digital humanities in our Zoom second life is that it is not a subject amenable to online learning. Our fearless leaders told us at the beginning of the semester that they will miss not having us all together in the lab, and now I know what they mean. Historians tend to be a solitary lot, grinding away in archives and trying to put our interpretations down on paper. When it comes to putting our ideas into ones and zeros, though, we need help. I would suggest that anyone wanting to learn about the digital humanities wait to take a course when you can work things out with people in real life. God, I can’t wait to sit at a table with my colleagues. I digress.
I have to admit, I struggled with this digital humanities stuff. I came into this without much knowledge (even less than I thought) and am leaving feeling like I only dipped my toes in the water. The nice thing is now I have some direction on where to go when I want to expand my knowledge. There was not enough time in a semester to make much real progress on fully comprehending the technical side, but we did get plenty of theoretical pondering on what the digital humanities are and their place in academia and beyond. We also were able to explore a wide range of tools which were more than just simply digging around in the sandbox. They exposed us to work across multiple disciplines in the humanities. It was especially interesting to see how big data is being manipulated and made sense of.
Although I will probably never venture into things like distant reading and other types of text analysis, at least I know they are out there and have a bit of working knowledge. One thing that kept me going this semester was a reading we had toward the beginning by Rachel Sagner Buurma and Anna Tione Levine where they outline the idea of sympathetic research imagination. As a scholar who has traversed multiple disciplines (way back in the day I was an English major [never would have met my wife without this interest], then I switched to get a degree in Anthropology and then another in Ecological Food and Farming Systems, and now I am pursuing History), I appreciate learning about the hybrid, trans(maybe even inter)-disciplinary space which is digital humanities. Our colleagues in the seminar were from across many disciplines and it was enlightening to see not just how digital tools fit into them all, but how people from many perspectives could collaborate in meaningful ways. I still am not quite sure what the “digital humanities” are, though (I honestly am still am trying to figure out “humanities”)…and I am still humbled.
I finally finished my archive/mapping prototype. You can check it out below. It was a painful exercise trying to figure out how to get everything working. Many times throughout the semester I wanted to just throw up my hands and say to hell with it. For example, spending hours trying to get Omeka Classic to work right, only to find after finally having a second set of eyes look at what I was doing they found a missing slash mark in a bit of code I edited. But I pushed on, and am glad for it. The hands-on experience I was pushed to do in this course got me to a level I never would have made it to on my own, and I want to expand this to my dissertation research in the future. Will this be “digital humanities”? I don’t know.
While all the academic calisthenics were great, and checked off a box in my requirements to graduate someday, the most value from this course came from what you are reading right now. As I mentioned way back in the first blog post, I have never had much of an online presence and never stuck with any sort of blog. While it seems elementary, simply building this WordPress site and having to post weekly gave me the discipline needed to have the confidence to write and have it instantly be readable by the world (I mean honestly, though, my analytics show only a handful of people, thanks mostly to my family. Thanks y’all!).
Will I keep posting now that I don’t have to? We’ll see. My summer plans include organizing primary sources I have collected over the last decade. The section on research management we had way back in February got me to start using Zotero to organize my files and I hope to integrate Tropy also. Additionally, I hope to continue building the Omeka archive I started with sources as I re-find them. Maybe I will keep up with this blog and let people now how it is going. But then again, I get my second vaccine shot in a couple of days and I may not want to sit in front of a computer for quite some time.
“To be a black person working to document black histories is to occupy 3 different worlds, in 3 different roles: as a spokesperson for your erased past, an activist in your contested present, [and] an architect of an alternative future.” Chao Tayiana Maina aka The Headstrong Historian Click on the logo above (which is owned by the organization) to access African Digital Heritage
This week we are attending the Global Digital Humanities Symposium sponsored by DH@MSU . The first talk of the conference was by Kenyan historian Chao Tayiana Maina whose interview by the People’s Stories Project was one of the readings chosen for this week. It was a wonderful talk, even within the confines of the Zoom-world. Maina’s work on centering the archive on local knowledge and truly putting “public history into the public domain” through the African Digital Heritage Project (Click the logo above and it will take you there. It’s great. Check it out.) which houses the Museum of British Colonialism answers the call by the two readings we looked at this week to conceptualize a digital world that is not dominated by the Global North’s perspectives on truth and knowledge. Decolonization involves historical work on digital humanities itself to uncover its role in neocolonialism. We don’t need just more access. We need more empathetic participation in archives which leads to what Maina called in her talk “restorative excavation” where survival and resistance are predominant, not domination and acquiescence to “civilization.”
Digitizing a book or, as Maina mentioned, a movie like Roosevelt’s trip to Kenya provided here by the library of Congress, without any contextualization perpetuates the idea that, for example in the movie, all Kenyans are exotic and “Zulu” no matter their ethnicity. Maini said that for a decade she had a “gnawing sense of discomfort” when she was researching the British Railway in the Kenyan National Archives. Whose stories are these? she asked herself. Kenyans were frozen in time in a cabinet of curiosities where the camera was a tool of colonial violence. Roopika Risam, drawing off the work of Frantz Fonan, claims that colonialism not only causes physical violence, but also figurative violence which is perpetuated in digital archives which do not confront the domination of the Global North and whiteness. To fix this violence, he argues, necessitates violence, not just diversification. The system needs to be upset. As Risam argues, it is not an “add and stir” process.
Maini showed in her talk how this violence manifests itself as an internalization. When she was a schoolchild in Kenya she was taught to list the advantages of colonialism. The teachers instructed them to include “civilization” and “Christianity.” History, she claimed was told “to us” and not ” about us.” Technology perpetuates this. Technology, she argued, is not abstract but is an extension of ourselves. Like I wrote last week, we exist in the digital world, and the violence of the colonial archive is real. Maini is making real connections with real people through the dissemination and empathetic interpretation of historical sources. For example, the interactive archive of Mau Mau freedom fighter detention camps is upsetting the archive by building a new archive. Relatives are commenting on the primary sources and interactive maps, giving voice to these fighters of black liberation who were considered terrorists up until the early sixties, and more important, telling the story from a Kenyan perspective, or “about us” and not “to us.”
As I fiddled around with the interpretation button today at the symposium and finally decided to take a break when I realized that I was stuck with listening to French, which my extent of speaking is embarrassingly American, I gained an understanding of how most of the world feels when it comes to digital humanities. I was brought up to speak the nearly universal language of digital humanities. And this is a problem. Alex Gil and Élica Ortega point out the obvious which people like me don’t usually think about. Digital humanities is dominated by English. The excuse that it makes more sense to have a universal language because then “we” don’t have to relearn everything is so ridiculously ethnocentric that it is almost silly that it needs to be pointed out. The second point they make, was not so obvious
DH is extremely wasteful. This latter observation was strange to me. We were always taught to “go paperless” but never think about the infrastructure needed to keep materials online indefinitely. 2% of the energy used in the US, for example, is for server hosts. Invariably, this affects the most vulnerable people in the world. Gil and Ortega suggest a “print it and delete it” course of action which would free up valuable server space that we all just unwittingly fill up with ten copies of a picture we took on our summer vacation. Digital neocolonialism is not always readily apparent.
The most important thing I took away from the readings this week and the talk this morning is summed up in a question Maini asked: “what do I learn from the archive and what do I add to the archive?” Everything we add to the archive, be it digital or analog, has power. We all need to be empathetic as we add to the materials which construct our shared historical truth. We need to decolonize our minds first, whether we are the colonized or the colonizer, if we are to decolonize digital humanities. It is not an easy task and involves being mindful of how others will interpret what we contribute.
Back in the nineties, when cyberspace was first coined, there was a utopian fervor about this new frontier where the individual could free itself from the trappings of corporate and government hegemony and domination. Cyberlibertarians taunted the corporations with idealistic manifestos where encryption keys would protect us all in a disembodied world. “Your legal concepts of property, expression, identity, movement, and context do not apply to us. They are all based on matter, and there is no matter here,” claimed EFF founder John Perry Barlow’s Declaration of the Independence of Cyberspace [which was part of the reading I suggested for this week, but put in the wrong category for last week. I think my mind is getting a little mushy this semester.] What these (mostly white, male, and middle class) over-confident pioneers missed was that this was not a new world. It was a distorted reflection of the old world, a world where, in the words of bell hooks vis-à-vis Christina Boyles’s article we read this week, “imperialist white supremacist capitalist heteropatriarchy” not only dominates, but keeps itself in power by controlling others through cultural hegemony and surveillance.
The internet is not a disembodied experience. We exist online, have lost control over that existence, are recreated online by forces outside our control, and the ramifications for this are real. Furthermore, the inequalities inherent in a neoliberal marketplace where profit by any means trumps the collective good were bound to dominate the space where most of us not only communicate but get our information.
As our readings this week make clear, something seemingly as innocuous as an internet search or database inquiry is not objective but relies on algorithms that subsist on subjective diets. As Safiya Umoja Noble shows in her work on the racial and gender bias of Google’s search engine [ironically, this official link for her book was more difficult than just linking to the preview on Google Books] the results are not simply a reflection of society as Google and others argue, but are a reflection of online activity distorted by neoliberalism. There is no incentive for Google to fix algorithms where pornography is the first thing that comes up when one searches “black girls.” Of course, Google remedied this when it would affect their reputation, i.e. the bottom line. Unfortunately, a monopoly like Google will always be reactive [Google may have “fixed” the black girl problem, but if you search “Asian girls” right now, one of the first page hits is the Wiki for “Asian fetish.”]. Yet, it is not simply a problem of economics, as I explored way back in my second blog post, it is also a reflection of an industry dominated by ideas of whiteness and masculinity. This is not only a problem of popular digital information, though, as Sharon Block shows in her critical exploration of the JSTOR Thesaurus topical algorithm.
Block explores the seemingly strange phenomenon of women’s history articles being categorized not by the topic of “women” but “men.” [Incidentally, this is an example of why I never use the topic searches in databases and only rely on full-text searches] JSTOR’s taxonomists chalked this up to the word “women” being “noise” that the algorithm could not understand. This is not a surprise they would give such an excuse given the “black box” nature of algorithms where those that create algorithms usually can’t explain results. The band-aid used in reaction to complaints is to simply remove words so the unruly monster recalibrates. But this does not fix the problem which goes beyond artificial intelligence. The problem is the way in which these algorithms are constructed which most of us do not understand, and if we did, they tend to be proprietary. So what do we do?
Along with diversifying the field of programming, which Noble claims is not an issue of people not wanting to be programmers but a lack of the industry wanting diverse programmers, all three of the works we read this week focus on end-user input. There needs to be more engagement with real people. As Noble states, “There is a missing social and human context in some types of algorithmically drive decision making, and this matters for everyone engaging with these types of technologies in everyday life” (10). This involves educating users. In the case of surveillance (both digital and analog) that discriminates against black and indigenous people, Christina Boyles teaches undergraduates to use “speculative thinking,” to go beyond academic frameworks like Foucault’s concept of panopticism, where hegemonic structures create a culture of self-surveillance which is equally applied across society. We know mathematical frameworks single out groups. They are not egalitarian in their recognition and in their retention of our identities.
This is difficult for for people like me, who the algorithms consider “normal,” to recognize. Our new imagined future can only be attained if recognition of the inequity is broad. The electronic frontier is a site of settler colonialism where corporations reap the benefits through many unwittingly compliant actors. While, as Noble argues, the ideal would be a shift away from a reliance on commercial search engines, our influence can force companies to change their algorithms. This has to be done not just as cyber-activists, though. According to Noble, “We will not sort out social inequality lying in bed staring at smartphones.”
There is no need to seek far for goodness and happiness. It is found in the imposed peace, in the rhythm of communal and private labor, in wealth amassed and distributed, in the mutual respect and reciprocal generosity that education can impart–Marcel Mauss, The Gift 1925, (1967 translation)
Marcel Mauss’s classic essay on “exchange in archaic societies” has made many people stop and think about value and exchange over the last century. Mauss shows that an economy based not solely on accumulation but also on giving things away is not a socialist utopia, but has been the foundation of modes of exchange throughout the world. Homo Economicus is a late-comer and did not evolve out of some natural need to accumulate and barter. By drawing off the ethnographic record of the time, Mauss showed that most human exchange is not and has not been predicated on market value, but by the obligation to reciprocate. His most famous example, the Kwakiutl (Kwakwaka’wakw) of the Northwest’s Potlatch, actually flips the concepts of value and prestige on its head. Leaders go broke out-giving each other to gain prestige. Mauss, with the help of fellow sociologist Georges Davy, uncovered potlatch correlates throughout European history and the ethnographic record and ended with a treatise for France to embrace a gift-based economy.
“Gift economy” or “share economy” is bantered about much nowadays, from vegan restaurants to rideshares. Most of these experiments are based on the notion that if everyone gave freely, all of our needs would be fulfilled. Yet, such a scheme ignores the idea of obligation. When you receive a gift, there is always some sort of obligation to reciprocate, albeit not always directly back to the giver.
So, what does all of this have to do with open source publishing? Well, academic publishing is big business, but is predicated on the obligation of the academic to give away their work with the expectation of some sort of pay-back. It is a complex notion of generalized reciprocity based on scholarly generosity. As those who have written, edited, or reviewed for an academic publisher well know, those that make it go round are not directly paid. They are obliged to give with the expectance of payment in prestige (or as Bourdieu would call symbolic capital) and monetary compensation through professional advancement. And, as Katherine Fitzpatrick points out, academics tend to believe that prestige comes from the most exclusive journals, usually those which charge exorbitant prices for access.
Fitzpatrick calls for scholars to shift the emphasis from traditional exclusivity to public (open) access. We should look at publications not as a way to pay back all of those who got us to where we are, but to benefit those coming up behind us, to pay our knowledge forward in ways that expand access. This does not diminish quality because if the best scholars decide to gift their labor to open-access journals then, in theory, quality will shift with them. Yet, as Martin Paul Eve points out, prestige takes time and is not just intertwined with the idea of quality, but used as a proxy for it. The other great point in Eve’s chapter on the economics of open source publishing is the reality of the academic economy does not fit into the idealized notion of reciprocity.
Fitzpatrick states that, “Scholarly authors write in order to get their ideas into circulation within their fields and, like many musicians today, are paid not for their publications but for their performances, whether in the classroom or on the lecture circuit.” What about all of those part-time workers? According to the NCES, 46% of professors are part-time, and a quarter of those rely on public assistance. As a veteran of the adjunct circuit I know that many of those “part-time” workers are teaching more courses than full-time professors. Yet, advancement relies upon publication, so you try to squeeze in some research between planning for lectures, grading papers, and working a second job. I don’t include this for pity, but to highlight the incongruities of a supply-side economy which relies upon the accumulation of symbolic (advancement) and cultural (academic publishing experience) capital in place of a living wage among the labor force.
Another thought that came up while reading for this week was the role of the public university in providing access. When stacks were physical, anyone could wander into the library of a public university and browse. Now that it is nearly all digital, the public still can get access if they are on most campuses. But why not make access free off-campus? It is a public institution which pays the subscriptions. Anyone living in the state should be able to remotely access the databases. The green open access (an arrangement where publishers allow writers to re-publish their work) repositories provided by universities is a good step in this direction, but is still limited to those journals which allow it. I understand this does not fix the issue of library costs, but maybe the general public would be willing to increase education funding if they received a tangible product.
Finally, I was surprised that the ubiquitous use of illegal databases was not covered in any of our readings. I am not going to say I have never relied upon the illegal dissemination of scholarly work, especially when quickly putting together a course in less than a week’s notice. Other times I have directly contacted researchers who sent me copies that the library could not get on course reserve in the time needed. There is a robust informal gift economy in the academic world. Most people are wiling to share and I would argue that the majority of academics are not comfortable with the current arrangement and would not care if someone “stole” a copy of their article. It will be interesting to see where this all heads over the next couple of decades. Can scholars shift the system toward a more inclusive model while retaining the necessary exclusivity? Will they keep giving if the system does not give back? Already there have been some major movements against the traditional publishing models, such as the UC system brokering an open-access deal with Elsevier As Eve claims, “at the moment, it is possible to pay, globally, for all the research that is published.” The question is, who will pay and will they pay it forward.
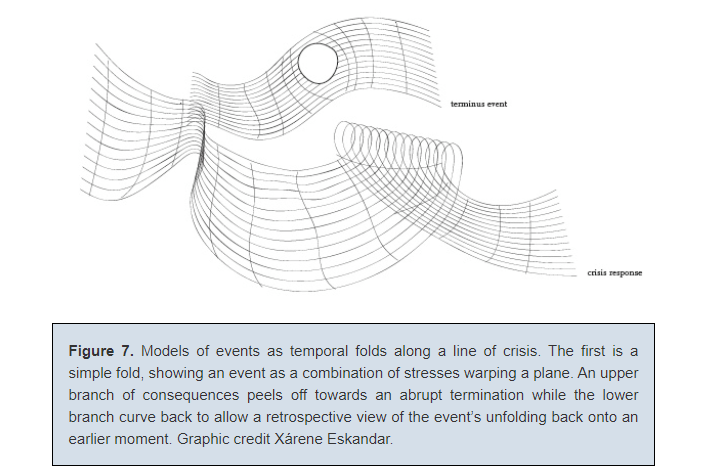
From: Drucker, Johanna. “Humanities Approaches to Graphical Display.” Digital Humanities Quarterly 005, no. 1 (March 10, 2011).
There is so much to think about when trying to convey abstract information in a concrete and useful manner. With all of the currently accessible tools, we can make a lot of pretty visualizations but are they valuable representations of reality? Much thought, from color schemes to categorical axes, should go into how we represent our data. What struck me the most in the readings for this week was the concept of all data as capta. This term is new to me. What it boils down to is that data is not something that is just out there for us to discover. We make it.
In a way, all data is qualitative. Some things can be enumerated. Yet, the categories for counting are socio-cultural constructs, usually embedded in binary categorizations which work well to order things but do not reflect reality. Furthermore, as Katherine Hepworth and Christopher Church point out, there are power-laden underpinnings to the standard ways that we visualize enumerated data. Bar charts, line graphs, and other old-school vehicles for data visualization are products of colonization. So what do we do if we take such a phenomenological perspective? How do we ethically relay information in digestible formats which any of my relatives would understand, while at the same time pay close attention to the situated knowledge and power inherent in our visualizations?
There were a couple of examples brought up this week which help in thinking about the subjectivity of data visualization and ethical considerations: Hepworth and Church’s exploration of two mapping visualizations on lynching and white supremacy in the United States and John Snow’s cholera maps from 1854 as critically explored by Johanna Drucker. In regard to the latter, Drucker helped make the concept of data as capta easy to understand by looking at Snow’s famous map of London’s Soho district, populated with dots of cholera cases. As mentioned in the extremely handy The Historian’s Macroscope: Big Digital History, Snow’s dot-density map was not the wrong type of map for pinpointing the source of the disease (As the authors of this book let us know, there are no “right” visualizations). It worked in ferreting out the water pump. Yet, as Drucker shows, such a map is an example of “co-dependent constructivism.” In other words, the “realism” of the map is “observer-independent.” The only variable that defines a person is that they have cholera. Drucker posits the question, “But what if we take the rate of deaths, their frequency, and chart that on a temporal axis inflected by increasing panic?” Or, in other words, how does one redraw the landscape to include emotions and gazes of those on the landscape? Much of what we read this week reminded me of Haraway’s “god-trick” explored in a previous post. Visualizations have a disembodied objectivity which is not reality.
Drucker brought up many interesting ideas for how we can think about and represent landscapes and temporalities that expand beyond cartesian models. Although she ended up with visualizations which reminded me more of charts in quantum physics books (See image above), the exercise of thinking about the relativity of time and space is important. If two people are riding together in a car down the freeway and one really has to go to the bathroom, those ten minutes until the next rest area will not be the same for each person. What it comes down to is understanding that the numbers we are visualizing are not just artifacts themselves, but also represent people, each with a situated perspective. Landscapes are complex.
Hepworth and Church show how the intentions of creators of representations of landscapes can mask such complexities. They critically examine the Equal Justice Initiative’s (EJI) Lynching in America choropleth map in relation to the Monroe & Florence Work Today’s White Supremacy Mob Violence interactive map. EJI’s work narrows the viewer’s focus to the south and focuses solely on lynching of African Americans. EJI’s map works extremely well in relaying the terror of lynching and its lingering geographical legacies. Yet, as the authors argue, their focus on the south and only African American mob violence masks the extent of structural racism and white supremacy. The White Supremacy Mob Violence map includes not just violence against other groups, notably Native Americans, but also extends the gaze across the United States. Additionally, the interactive nature of the map allows users to uncover personal information about victims and vignettes which give historical context. Careful planning from pre-data collecting to the publishing of visualizations can remedy blind spots and push historians to, as the authors claim vis a vis Alan Liu, “communicate humanity” by paying close attention to cultural criticism. So, this brings me to how I will think about space, time, and people when I move into my own projects.
We did a non-geospatial visualization exercise this week where we chose from a plethora of data to create representations in Flourish. I found some data from the City of Albuquerque which is one of the most generous municipalities with their datasets. I have to say, it came out pretty nice. After reading the instructions on what visualizations work best for the data you are representing in The Historian’s Macroscope: Big Digital History I decided that the hierarchy circles template would relay information on pollen data well. One would think that such a representation would be free of ethical and methodological issues. Nevertheless, there are variables masked in a representation like this. First of all, who decides what is the “west” and “east” of the city? More important, who are the people living in these areas? How does this fit with air quality in general? What kind of housing stock is in these areas? There are many other questions which could pop up when making a representation quickly like this. The simplicity of making such visualizations without any real preliminary work is a bit frightening after our readings for this week. This thing is published online. Is it saying something I don’t want to say?
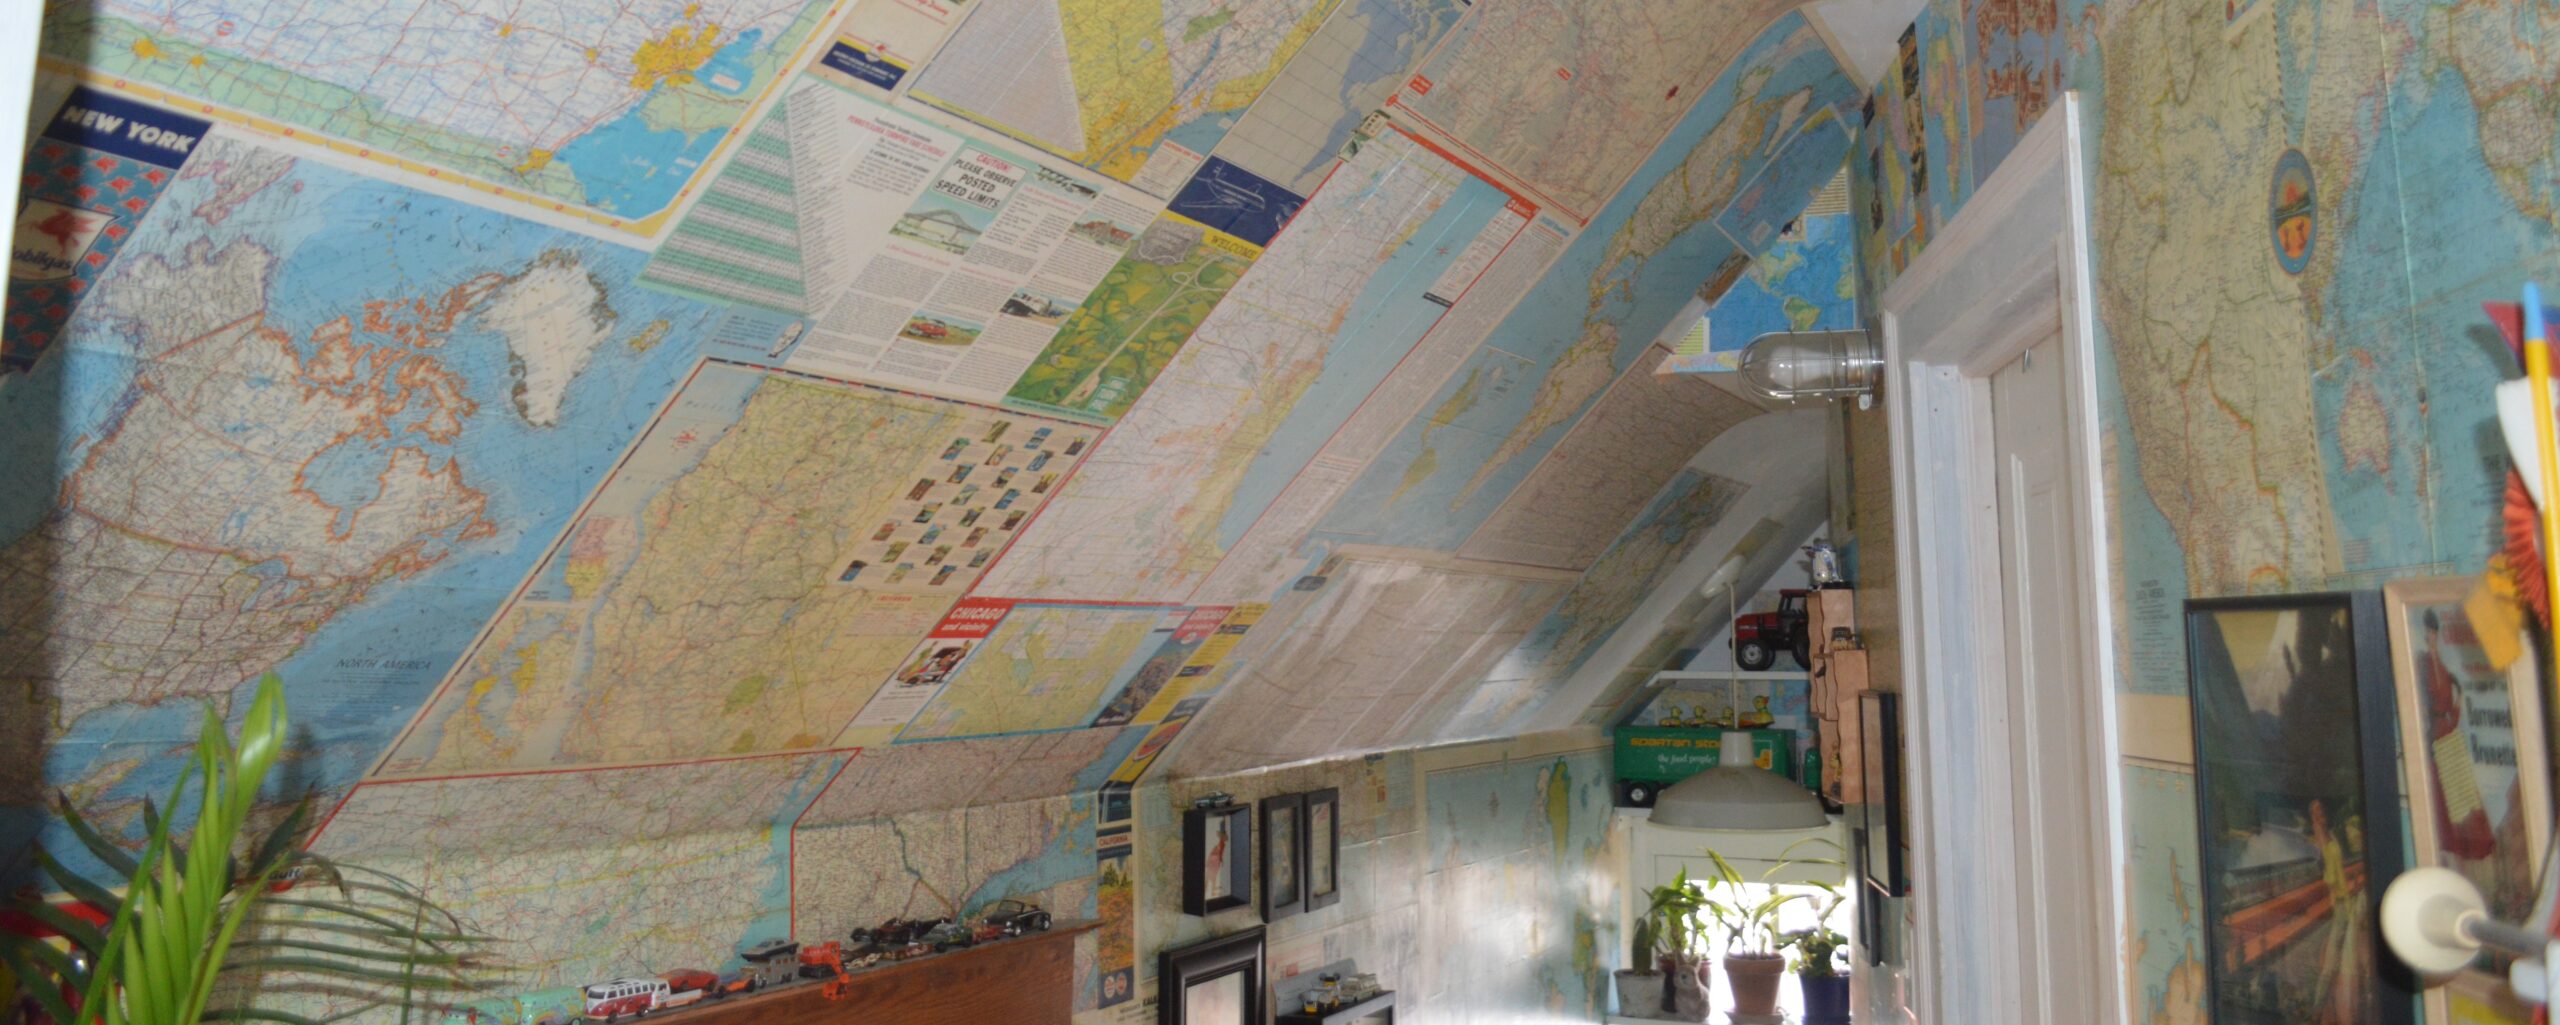
This is a picture of our hallway. As you can see, we are a house of map lovers. When I was a kid I used to stare at maps and globes for hours imagining trips to all the points (who am I kidding I still do this). We still don’t use GPS when we travel. There is something about seeing where you are on a paper map and scanning across the page imagining where you can go. Yet, maps don’t just tap into the little romantic explorers in our subconscious, they are an incredible tool for learning and research and making them has become ridiculously easy. Now, finding the data to build the map that may answer your question? That is a bit trickier.
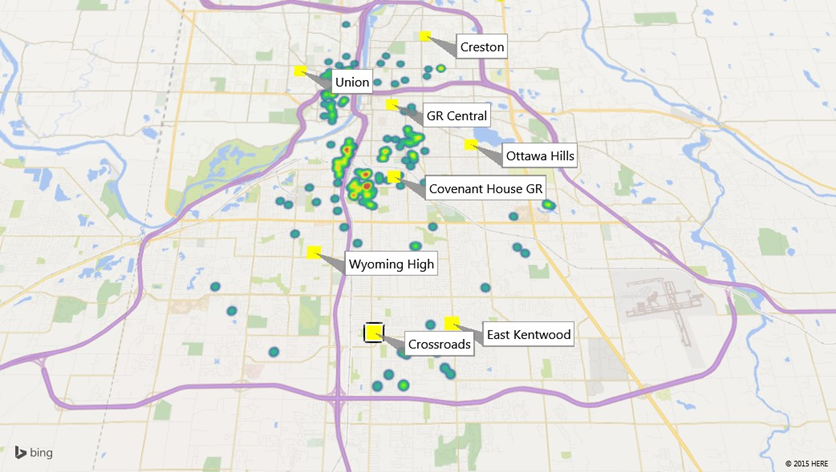
This week was much less frustrating than last, partly because I want to get this mapping thing down so I can try and map some urban food environments from the Progressive Era in Michigan. The last time I attempted mapping data was about five years ago when asked to present a feasibility report to the board of the charter school district I was working for. I used an Excel Google Maps plugin and this is one of the maps I ended up making which shows the concentration of households for English as second language students attending Covenant House Grand Rapids in relation to Grand Rapids’ high schools:
I thought this map was pretty nifty as it provided the board with quick information, but it took some time to put it together. This week, once I figured out the interface on Flourish, I was able to throw this map together from the data our professors gave us in a just few minutes. Click around and you will find more data:
To learn the Flourish interface I just jumped in with my own data and made a simple narrative map of the historical marketplaces in Grand Rapids (see below). I found that Flourish would probably have the most potential of the three platforms we looked at since it works decent for narrative maps and for data maps. What I really want to do, though, is make an interactive map of grocery stores, marketplaces, and public gardens (probably school and community gardens) in Grand Rapids in relation to the demographics of neighborhoods over time between 1895 and 1925. Historical census data, let alone mapping data (of which much is found here) does not usually disaggregate to the city level, let alone neighborhood level. However, there may be other ways to get an idea of neighborhood makeup.
The Survey, one of the leading social work journals of the Progressive Era, published this map showing how old saloons were reused during prohibition. What is really fascinating about this map, though, is that they marked out the racial and ethnic makeup of the neighborhoods. Maps are reflections of power and how space is made into subjective reality, and it is interesting how social workers thought it would be important to show where immigrants and African Americans lived in relation to saloons.
Survey Associates and Charity Organization Society of the City of New York. The Survey September 1920-March 1921. [East Stroudsburg, Pa., Survey Associates], 1921. http://archive.org/details/surveysepmar1921surv.
I would like to use this map as a layer for my maps so I went over to MapWarper and rectified it. It is amazing how quickly I was able to do this. I once rectified a map “by hand” years ago in Microsoft Publisher. It worked fine for a visualization for a presentation where I physically put points on the map. Now I was able to upload my map, pick some reference points, and then download the data to use in mapping software. I planned to try out Neatline with this data but am having trouble getting the API to work properly, so that will have to be saved for later.
I feel I made some good progress this week toward thinking about what kinds of maps would be the most useful to generate and answer questions in my own work and offer others the opportunity to think about Grand Rapids history in novel ways. A narrative map is great, but I would love to make an interactive historical data map like that produced by Tim Hitchcock and his team. Locating London’s Past is an incredible example of the power at our fingertips without having to be well-versed in complex coding. Users can go right in and choose data which shows up on rectified maps of London. Such tools can get us thinking about, in the words of Hitchcock, “landscapes and cityscapes [that] only exist between the ears of their denizens.” We cannot know what is going on inside the heads of the people we study, but we can begin constructing an idea of how they imagined space by distant reading newspapers and mapping place words, giving spatial context to narratives, or spatially presenting historical data. I hope to be able to bring together the narrative map and data map. We’ll see. It would be a project that, where as Todd Presner and David Shepard show in their brief overview of geospatial humanities, the disciplines of urban planning and would come together with history to uncover valuable information which could help inform future communities.
Well, as you can see I did not make my Saturday deadline again. I got pretty caught up in mucking around with maps since this is an area I plan to pursue in my own research. Next week I will be looking deeper into visualization and hopefully it will build on what I started this week.
This week I dove into more computational text analysis. While I gained a better understanding of the methodology through the articles we read, when it came time to learn how to use the tools, my performance was a bit lackluster. For God’s sake, it took me hours just to get the Natural Language Tool Kit to download. After following Roy’s advice, and a tip by my colleague Katherine Knowles (who also had issues with the setup), pointing out that the download page opens behind the browser pages when you run the cell for NLTK on Anaconda, I was finally able to go though the required exercises for the week. Normally, I work on the exercises on Saturday and post my reflections for the week, but as you can see, it spilled over to Sunday this week. Given I had no background in Python, I expected this to be a bit of a bumpy week, and it was. The problem wasn’t getting my feet wet with a new language. It was me wandering aimlessly into the world of open-source computational notebooks.
Once I finally got things up and running, I realized just how lazy I have been in the past with learning any sort of computer code. My experience is very much “this needs to be done, let me copy and paste what I can to get the result I need.” As a data specialist at a high school, I attended multiple trainings and conferences to learn how to use one relational database system that was anything but open-source. I became familiar with SQL queries and created pages for administrators to pull student data from our database. When queries started having multiple conditions the code was insufferably long and not practical-looking, but I just pasted it from another user in my sharing network without understanding what it meant. I have always been an indolent language learner, be it computer or natural language. Being able to order coffee, eat, and find the bathroom has kind of been my take on language. I know, stereotypical person from the US. It was humbling to actually do some exercises that tested what I was learning.
It is a shame it took me so long to get everything set up because I enjoyed what I could finish in the tutorials (especially exploring the Holy Grail. I did not know that Python was named after Monty Python. How cool is that?) and would like to spend more time dinking around. But, alas, spending thirty hours learning Python just doesn’t fit right now, and will probably not help me work toward the proposal I should be working on for my mapping project. But at least I now understand the infrastructure and am set up to revisit the NLTK tutorials.
The readings this week were also extremely helpful in furthering my understanding of the potentials and limitations of computational text analysis. I would suggest Dong Nguyen et al’s article for anyone trying to figure out how social and cultural research can be accomplished through computational analysis. Their step-by-step deconstruction of methodology works well for those of us trained in social science and think in a classic hourglass of research framework. What was most interesting to me, and goes back to questions I had last week, is the selection and quality of textual data.
The authors discuss the proliferation of born-digital data and the ethical issues with using this information without the consent of the those that produced it, and more important, the ability for open-sourced methodologies to be used in nefarious ways. The example of analyzing Reddit for hate speech is a great example. If a model is created that traces hate speech, one could theoretically use this program to connect networks of racists. The other issue I found interesting was that of the selectivity of analog texts that have been digitized and the need to marry digital research with qualitative studies.
Sandeep Soni et al’s work on abolitionist newspapers uses robust statistical analysis of semantic change over time by randomly aggregating newspapers from the Accessible Archives which provide racial and gender identification of editors of newspapers. While their results cannot take the place of qualitative research which relies on human intuition, it directs further research questions and narrative opportunities. Their findings that women-edited, both black and white, papers were at the vanguard of lexical change, opens up interesting avenues for historians. To find that lexical change, they focused on “neighbor” words around the standard words like “freedom,” and more important, randomized their analysis to make up for gaps in time and the archive. This is important, and comes to my final reflection which goes back to the idea of availability.
Nguyen et al point to the importance of understanding why particular newspapers are digitized. Silences of the archive increase as access expands. Historians are using traditional archival methods with digitized documents which is not the same as visiting an archive. The bias of this approach can be addressed by marrying computational methods with text selections.
For example (and I don’t want to simply pick on one book because this is widespread and this is an excellent monograph, but it came to mind while reading it), Paul Escott’s work on white supremacy in the Civil War North analyzes northern newspapers to show the explicit racism throughout the region, even among many abolitionist-supporting publications. Only two papers were “systematically studied” in Michigan: The Detroit Free Press and the Grand Haven News. It seemed like an odd choice to pick this little random town, but then again, the digital version of this paper is easily accessible. Escott’s extensive analysis and piles of qualitative data make for a compelling argument. However, some front-end work like the statistical research done by Sandeep Sone et al could have answered the question I had while reading the book and echoed by Nguyen, “are the sources representative?” Perhaps I am beginning to see the value in this stuff.
Visualization of James Ralph Jewell’s Agricultural Education Including Nature Study and School Gardens, written in 1907 for the US Dept, of the Interior’s Bureau of Education. This document is part of a digital archive of school garden literature created by MSU librarian Suzi Teghtmeyer.
I just made something for an exercise in a doctoral seminar that looks like it was done by a second grader on Microsoft Paint. Huh. Yet, this is more than just some scribbles. It is a visualization of the five most common terms in a primary document. It was made by Voyant using a tool called “knots.” An animated line represents each of the five most common words in a text (outside of designated stop words). Each line turns when a word is used and moves in straight line when it is not. As the application reads the document (it will only do one at a time) music plays reminiscent of György Ligeti’s “micropolyphonic” symphonies. It’s pretty cool, in a 2001 SO retro sort of way. Press play above and wait a few seconds and you can experience it.
But does it really mean anything? I understand the uses of text visualizations like word clouds, at least as a quick way to map out some important words in a text. I have had luck using them to get students to discuss readings. But is serious computational analysis a useful tool for historians? Probably, but I just don’t know enough about it.
I came into this with absolutely no clue about what computational text analysis is. After reading Ted Underwood’s retrospective I feel I am beginning to understand a bit of what this is all about. Although I am not very familiar with literary analysis, I am familiar with mid-century structuralism and content analysis which used literary criticism as one of its guideposts to study cultures and societies. As Underwood argues, “distant reading” may have been coined by Franco Moretti in 2000 (and I am not going to act like I have read Moretti), but scholars have been attempting to connect literary canons with society and culture for quite some time.
The gist, at least from what I garnered from my limited background, is that computational text analysis, or what is called “distant reading,” is a form of extreme, objective, structural analysis of texts, or more aptly, a strict etic perspective across a corpus of texts producing quantitative data which makes up for the reality that no one can read everything from a particular genre or time period. Thick meaning is eschewed for algorithmic patterns, using Latent Dirichlet allocation (I don’t really know how this works, but I thought I would look up the acronym LDA that kept popping up). Or, to put it in regular people terms, you try to include every text you can and not sit down and analyze a few books closely.
Counting words and phrases over an entire archive can uncover patterns not apparent by simply reading what are considered representative texts, and those patterns can answer questions and create new ones. I am a bit skeptical of the process, but then again, I am in no educated position to enter the fray. Its use for historians became a bit more clear after I looked at Robert K. Nilson’s Mining the Dispatch site, however.
Nilson used MALLET, a free and powerful topic modeling tool, to analyze the complete archive of the Richmond Daily Dispatch, not just samples. Topics are uncovered based on words and word clusters which can reveal patterns that would unlikely be seen through close reading. It can be powerful, as Nilson shows through dentification of spikes in fugitive slave ads each time the Union Army came close to Richmond. This observation would have been nearly impossible without topic modeling.
Although I see the power in these tools, I am not sure they will make there way into my own work. It would be interesting to see when retail farmers markets opened around Michigan with topic modeling through newspapers. I did dink around a bit with the the interface for MALLET we were to use for our exercise, but I had issues getting intelligible output when I switched to some of my own texts. I also am not sure how you get access to an entire archive that is behind a paywall. Do you download the whole thing? Another question to think about as I soldier forward into more of this text analysis stuff for next week. Maybe I can make some more meaningful scribbles.
This week we were given free reign to explore all of the topics for the next five weeks which should lead to a Digital Humanities Advancements grant proposal draft and some sort of prototype. Like my colleague Teresa Goforth, I wanted to jump ahead to the mapping section. But I decided that I should get some of the basics out of the way first, since most of this is new to me. Therefore, I spent the week looking at platforms to organize archival data.
As you may notice, I did not post on my usual day: Tuesdays before we have class. That is because I spent way too much time fiddling about with platforms. I learn best by screwing things up (the Beetle in the picture below is a great example of a car I completely destroyed as a young whipper-snapper) so I spent the week trying to break things. After hours of dead-ends, Google searches, and learning a bunch of new acronyms, I can say that nothing is broken and I became quite acquainted with Omeka and Scalar.
What I learned most this week as I test-drove out these platforms, was that my archival skills are completely horrendous. This comes as no surprise to me. I tend to think only about the now when working on projects. I always lose stuff. I can’t tell you how many 13mm wrenches I have owned over the last twenty years. No matter how many pegboards and toolboxes I have in the garage and basement, there seems to always be a void where I thought I put that wrench. My organization skills are ridiculous. I imagine there are many whose heart rate would quicken when they look at my Gmail inbox number (11,921). These same habits cross over into the historical data I accumulated over the last decade. Metadata? Oh. I’ll deal with that after I have this paper finished for the conference tomorrow. Yeah, right.
To test-drive new platforms I attempted to transfer the information from my Listening to the Past page I started on the WordPress site and also started an exhibit of Progressive Era marketplaces in Grand Rapids. I wanted to see how different types of files work. I can say I did not succeed at either yet, but I did learn a lot on how each platform operates (For example, the FTP client in Omeka is built into our domains page which would have been good to know while I was square-hole pegging with a client on my PC). More important, I learned that I need to be better about provenance and rights.
It is quite humbling to stare down empty metadata fields. “Where the hell did this come from?” came up quite often. Sometimes this was followed by, “Oh, I have two other copies with some information in the filename.” This compounded when thinking about recordings I have. Some are interviews. Could the people still be alive? Should I track them down before posting this? Their descendants? One recording is from the defunct CCCP Soviet recording company. Are there copyright issues with that? I looked up what I could, and the legal ramifications were clear as mud on it. Luckily, my proposed project for this course is tentatively a mapping archive which shows food environments of Michigan cities during the Progressive Era.. It is highly doubtful that ethical issues will arise. Still, my undergraduate background in anthropology and interest in Cultural Resource Management always has me thinking about ownership of local knowledge.
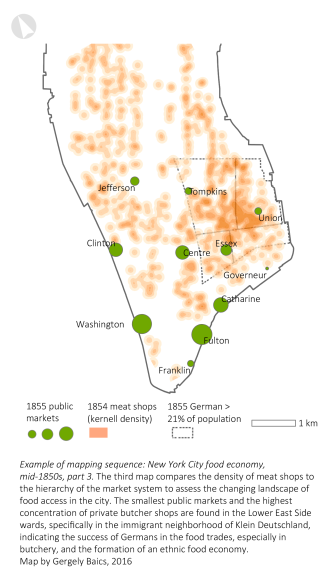
This is a map created by Gergely Baics of Barnard College, Columbia University on food access in 19th Century New York City. My goal is to develop this idea for smaller cities around the US. Check out his work here. For the names of the team responsible for all this work see the Appendix of Feeding Gotham.
The work done to create content management systems (CMSs) like Mukurtu is fascinating. Kimberly Christen’s article on the creation of a Traditional Knowledge Labels for users from indigenous communities to claim intellectual rights to archival sources by providing access to metadata gave a glimpse into the issues of promoting cultural knowledge while retaining control for those whose heritage is being shared. She brings up an interesting point which I had never thought about. One usually thinks of Public Domain sources as a feel-good place where some corporate entity is not lording over information. Yet, as Christen points out, much indigenous cultural knowledge has been put into the public domain without the consent of the creators, perpetuating the colonial domination of archives. It is important for all historians to think about how their archival data was created and if there are lingering inequities of power.
I plan to fiddle around with these sites more, but will more than likely abandon the projects I started to focus on the prototype for this course. Next week I will be diving into text analysis. I have no idea what this will entail. I’ll let you know next Saturday what I find out as I rip apart some more things.
I am not going to act like I fully comprehend the work of Donna Haraway. But I do revisit her Cyborg Manifesto every few years and try to wrap my head around it. Each time is a challenge where I come away feeling I might understand it a bit better, like a decades-long riddle. What is clear in her work, though, is that we have agency through our relationships with nature and machines to “not be Man.” Or in her most recent work, to regenerate from the waste of late capitalism, like compost, into something different, something where identities are not separate from animals and machines but also not quite holistically bound together in a hippie-dippy earth-mother sort of way. As she famously ends her manifesto: “I would rather be a cyborg than a goddess.” There is room for infinite difference in our digital, cyborg future, where identity expands beyond a patriarchal late capitalism defined by clear objectivities measured in subjective binaries. The way in which we manipulate data through our digital prosthetics offers a rhetorical frontier never before imagined.
Now you might be thinking, what the heck does this have to do with wheat and digital humanities? Well, while reading Catherine D’Ignazio and Lauren Klein’s chapter in Data Feminism on data visualization and objectivity, I was reminded of the data visualizations I often come across in US food and agricultural historical documents. D’Ignzazio and Klein explain how “objective” data visualization simply provides information in an easy-to-consume fashion. Arguing from Haraway’s concept of situated knowledge, such an assumption relies upon a false dichotomy which is gendered. It is generally accepted that data visualization should not be emotional. It should just relay the facts in a reasoned manner, in a masculine way (as if men are not emotional and women are always irrational).
The authors point to the data visualizations of W.E.B. Dubois as an example of powerful data rhetoric. His “data portraits” (shown here from a Smithsonian article) of the Black experience in the United States for the Paris Exposition in 1900 are an example of not just deft pieces of rhetoric standing in opposition to the white supremacy of knowledge but also proto-avant garde artwork. Rhetorical visualization of data was a widespread tactic among social scientists of the time, not only used as tools to show inequality by social scientists but also by government agencies to reinforce American ideals such as agrarian exceptionalism.
The third principle in the Data Feminism book is to dissolve such binaries and embrace emotion and embodiment. Thus, visualizations should persuade beyond sterile data points. They should do more than transmit information, they should persuade as a form of rhetoric. This is not a new concept in the world of data visualization, although the objective is not always one of liberation.
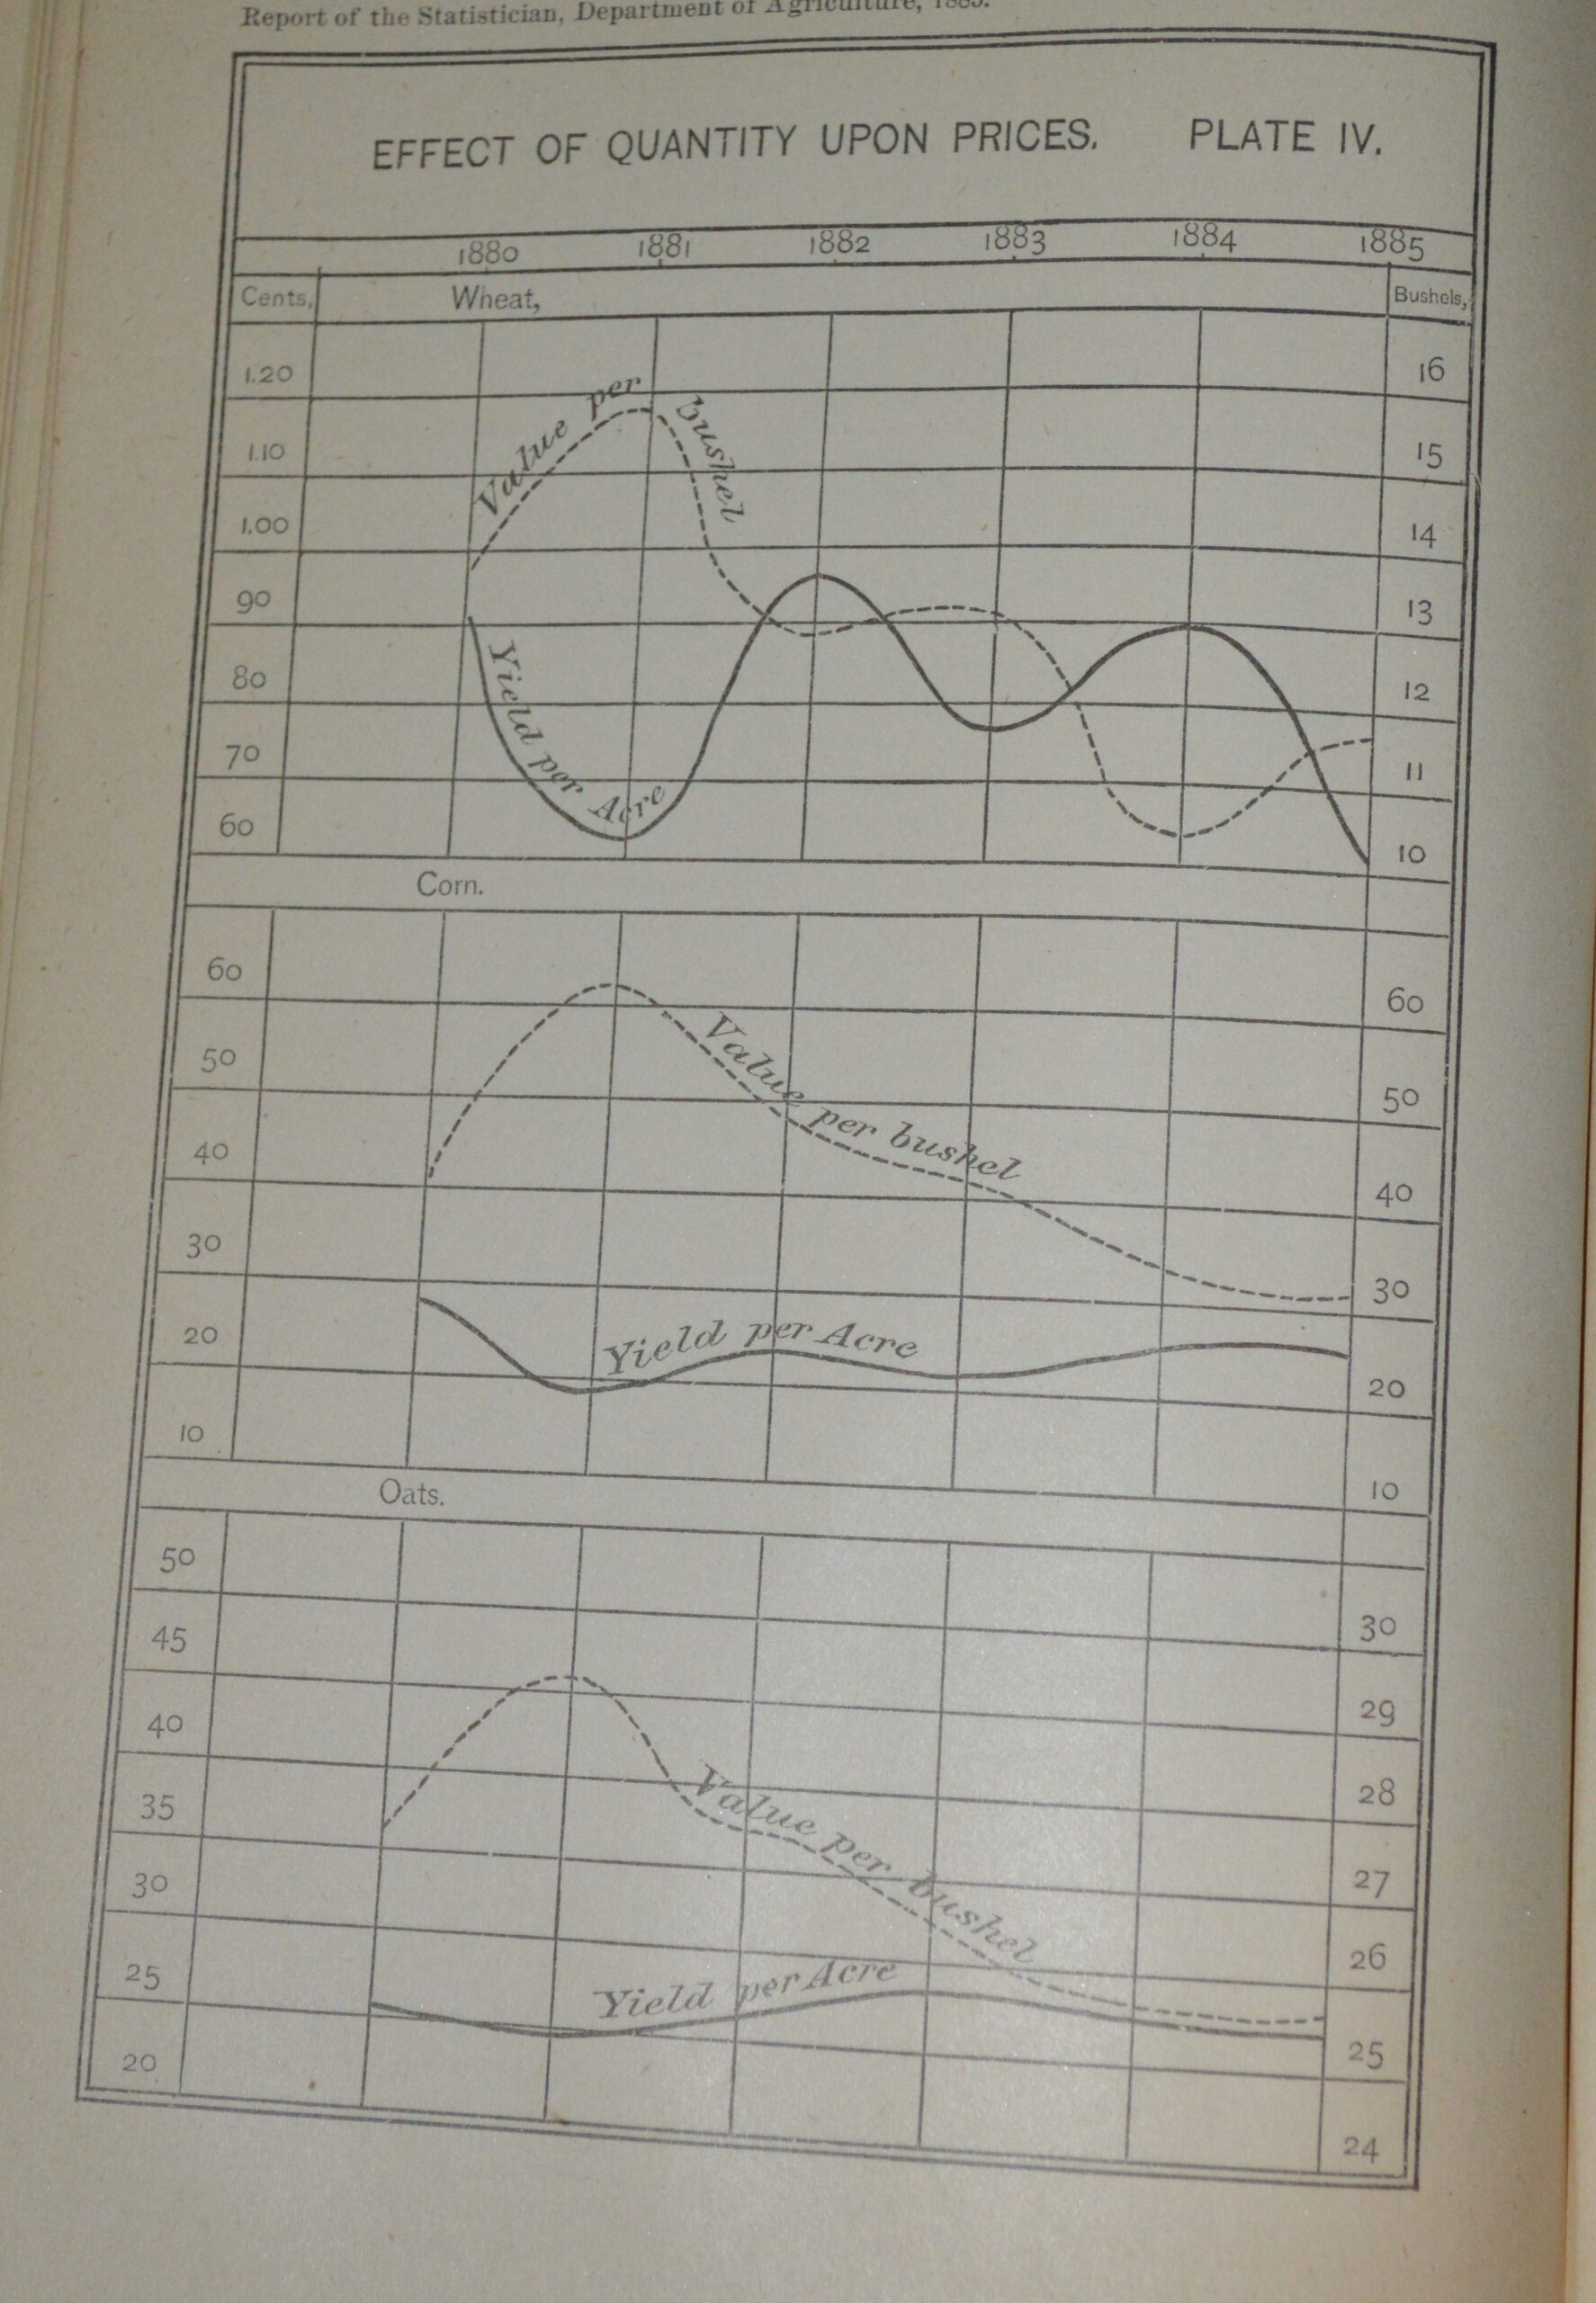
Annual report of Commissioner of Agriculture, 1885,, Washington. Government Printing Office, page 375. personal collection.
Take the wheat production and exportation visualization above from the 1885 report of the Commissioner of Agriculture. No other commodity has such an artistically-rendered graph in the report. The statistician engaged in what Haraway calls the “god trick” of zooming out to a generalization while invoking the specific. The agrarian-themed scene suggests the particularity of individual farms while integrating the general data to which the farm contributes. Wheat prices were at the forefront of American agricultural consciousness as they were tied to global competition. 1885 was a record-low year for US farmers.
The above graphic’s small sack of wheat sits next to a scrubby tree. It is juxtaposed with the larger bag and a neat sheaf of wheat from the most recent half-decade. A letter from a statistician accompanies the graphic stating that the “countries of high civilization” with “progressive agriculture” such as the United States will continue increasing production in light of the recent setbacks, assuaging the fears of the western farmer. The farmer is eased into the graphic on the overleaf which gives a much less emotional presentation of the actual situation:
Yet, the graphic is not void of emotion. By placing the wheat next to the corn and oats, the researcher has created what D’Ignzazio and Klein call visceral uncertainty. Unlike other commodities, supply and demand was affected by global production and the uncertainty of prices is embodied in the criss-crossing lines, which influences the decision of the farmer (do I gamble with wheat?).
The head statistician for the Secretary of agriculture at the time, J.R. Dodge, told the New Orleans Cotton convention that the best method for conveying statistics is the “graphic method” and his work was created so someone could run through an exhibition and “read intelligently as he runs.” It is highly unlikely, though, that Mr. Dodge was solely responsible for the eighty pages of text, charts, tables, and illustrations in his government reports (and that there were not also not southern women interested in cotton production). It begs the question: Who drew these charts? The invisible labor in the data supply chain has not gone away.
Like the unknown workers in the stats department of USDA in the 19th Century, Catherine D’Ignazio and Lauren Klein show how the invisible workers behind the current data world consistently are women, a high percentage women of color. They tend to also be relegated as second-class employees, such as the people scanning our Google books who do not have equal access to the campus.
We live in a time where the tools are available to create a world where data can be used to quickly get information to (and about) a lot of people at once. The way that information gets to people is important. The way data is organized and interpreted is ethical. Do we just try to send it out without any subjective attachment, without any emotion? Of course, this is impossible. In fact, it is becoming more impossible as we integrate into the digital world. Subjectivity and objectivity blur in our new metaverse where we become avatars (How many of us have had a conversation or meeting with a photo over the last year?).
In our discussion last week the concept of metaphors for Digital Humanities were discussed. I like the idea of the feminist cyborg. The paradox of humanity and digital is too large to ignore and we are all a one of many now, whether close-reading Luddites like me like it or not.
[P.S. I was going to explore the idea of data models. I once managed a database by the seat of my pants with little existing knowledge amongst fellow employees who were creating data that, in the words of Julia Flanders and Fotis Jannidis, made “sense in their head,” usually as color-coded spreadsheets or lists on word documents. I am no expert on data computing, but I learned quickly the importance of formal models. It just didn’t fit here. Maybe next time.]
“One of the advantages of anthropology as a scholarly enterprise is that no one, including its practitioners, quite knows exactly what it is” Interpretation of Culture–Clifford Geertz
After ruminating a bit over last week’s class discussion about what [the] digital humanities are/is, I could not help thinking about the above quote by symbolic anthropologist Clifford Geertz. As an undergraduate in anthropology at the turn of the century (sounds so weird to say that), I was immersed in the identity crisis of the discipline. Is it a science? Is it a humanity? Are anthropologists biologically deterministic, genocidal maniacs [see Napoleon Chagnon] or activist/relativists (paternalistically?) giving voice to subaltern communities; to hell with science [see Marshall Sahlins]? Where does archaeology fit? What about evolutionary biology? Are we all just writing fiction? Everything was up for debate. Yet, as Geertz sagely observed, this allowed for flexibility to explore new methods for the construction of novel epistemologies and cultural frameworks. Indeed, what would the humanities be without his (with a wink to Gilbert Ryle’s wink) thick description as an interpretive tool? If anthropology and history are any indicator, DH is just getting started in its quest of identity. And this is a good thing. Yet, it is not simply the identity of DH which is up for grabs, but also the definition and use of its base principle, namely data.
What are data (and how do you pronounce it? More on this later)? Trevor Owen offers reasons why data should concern humanists. First, it is a cultural artifact This means that it was created by people. Data is not something we stumble across in the forest. However, the data we create about the thing we found in the forest is more than a record of the thing itself. The logic of categorization, the language used, the intended audience, the contexts it is used, etc. all provide, as Owen claims, evidentiary value. Indeed, one can read data as texts. However, text is also data. It is strange that “data” somehow means only quantitative data. Texts can also be data, and this is where I feel a bit more comfortable.
I feel like I was dropped into a different time period after our readings for this week. The last time I used software to organize qualitative data was over fifteen years ago when I collected and coded field notes for an ethnographic field school. This was done on an early version of Atlas.ti. and I really didn’t know what I was doing. What is a hermeneutical unit, anyway? My undergraduate methods training consisted of writing descriptive field notes, typing them in a word processor, coding them, and then looking for patterns. It was tedious, but not as bad as using literal note cards. At least there was ctrl-f. While reading the article by Katie Rawson and Trevor Muñoz about “cleaning” data and their work on the New York Public Library’s collective transcribing project What’s on the Menu, I could not help but think of Yale’s Human Relations Area Files started in 1930 to offer a centralized location for coded field notes from ethnographers around the world. Imagine trying to find how many instances of mashed potatoes occurs in those drawers!
Photo and caption from the Human Relation Area Files website, https://hraf.yale.edu/about/history-and-development/
Rawson and Muñoz find that making sense of qualitative data is a tricky business beyond computer-assisted counting. When trying to “clean” up data for scalability there is always loss on account of bounded definitions of relationships and even the things themselves. They argue for Anna Tsing’s salvage approach she uses when describing global political ecology which is based on non-scalability. There are countless relationships and meanings inherent to and between qualitative data and the systems being created for projects like What’s on the Menu accelerate possibilities of grounded theory.
The HRAF relied upon shared codes among scholars that “nested” similar data together, facilitating ease in retrieval and cross-cultural comparison. These categories were created by and for (mostly white and male) anthropologists. The nesting is precise, but is it representative? Although I am completely ignorant as to the workings of the new systems, I can see the massive potential for diverse research questions induced from novel groupings. What I am most concerned with at the moment, though, is getting all of my own data together which is strewn all over hard drives, notebooks, and who knows where. Organization is not my strong suit and I am excited to explore new modes of curing my disheveled ills, or more precisely curating.
Now, as far as the pronunciation of “data.”
Is it dayta or dahta? (and of course they are data. Datum is) Well, I guess it depends. I am more comfortable with the former. This could be because I watched a lot of Next Generation in my high school years and beyond. Brent Spiner claims this is all because of Patrick Stewart. That’s it for now. Live long and prosper, and stay safe out there…